Detailed Instructions
Getting started is as simple as 1-2-3: Prepare your data.
 Upload your data.
 View your forecasts.
Prepare Your Data
Populate our simple template with your historic data using your favorite spreadsheet program.
You can download a template with or without example data below.
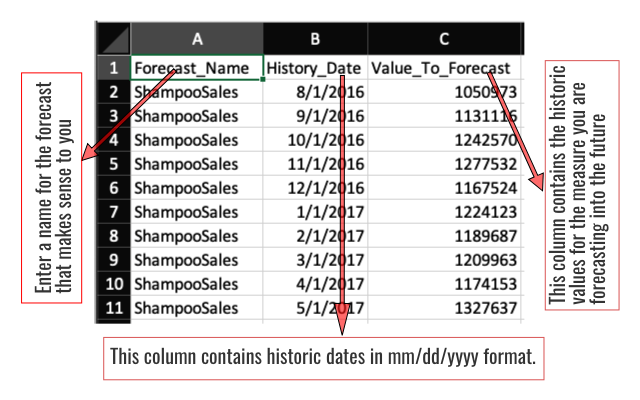
The first row in the file contains the column names (3 of them) in the following sequence:
- Forecast_Name
This is a friendly name you assign to the forecast you are creating. The actual name is not important, as long as it helps you identify the forecast for your own purposes. For example this could be an item or product such as toothpaste or shampoo for which you are forecasting sales. Another example is the name of a call center for which you are forecasting call volumes. A single file can contain multiple forecast names. See the example file to see how this works. - History_Date
The dates of the historical data points in your file. For example if you are uploading a sales quantity for May 2017, then this should be 2017/05/01 (yyyy/mm/dd). If you are uploading weekly data this would be the first day of the week in question. For daily data just upload the date for the day and so forth. While our system can interpret a variety of date formats, we recommend using yyyy/mm/dd. - Value_To_Forecast
This is the historic data that you want to forecast into the future. E.g. historic sales for shampoo.

Upload Your Data
Click on the 'New Uploads' menu item under 'Uploads' to be taken to the screen below. Now simply upload the data prepared in step 1 above. Alternatively just upload the example file which we have already prepared for you. You can get the file here.
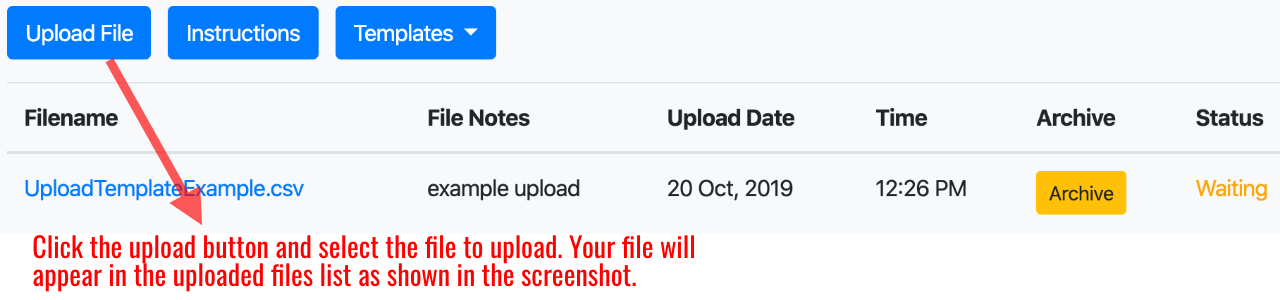
The uploaded file will appear in your upload list, starting with a status of 'waiting'. After a few seconds the status of the file will change to
'processing' and finally 'forecasted'. See the screenshot below.
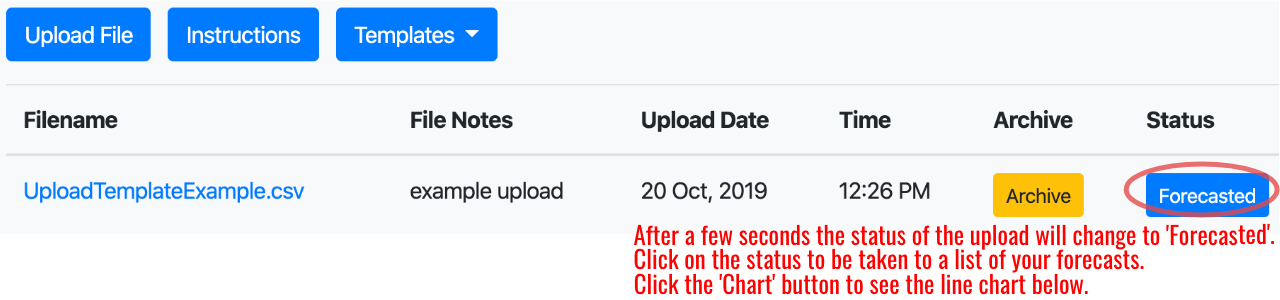
Clicking on the forecasted status will take you to a screen listing all of your forecasts with the latest forecasts at the top of the list.
View Your Forecasts
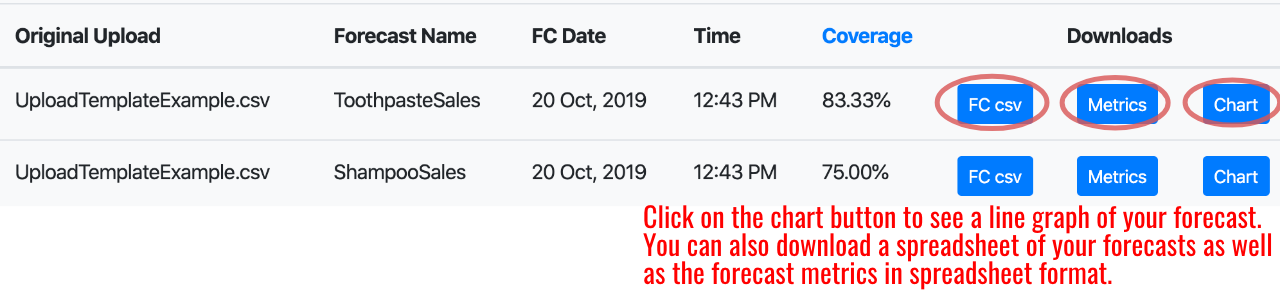
Click on the 'New Forecasts' menu item under 'Forecasts' to be taken to the screen below, listing all of your forecasts with the newest forecast on top.
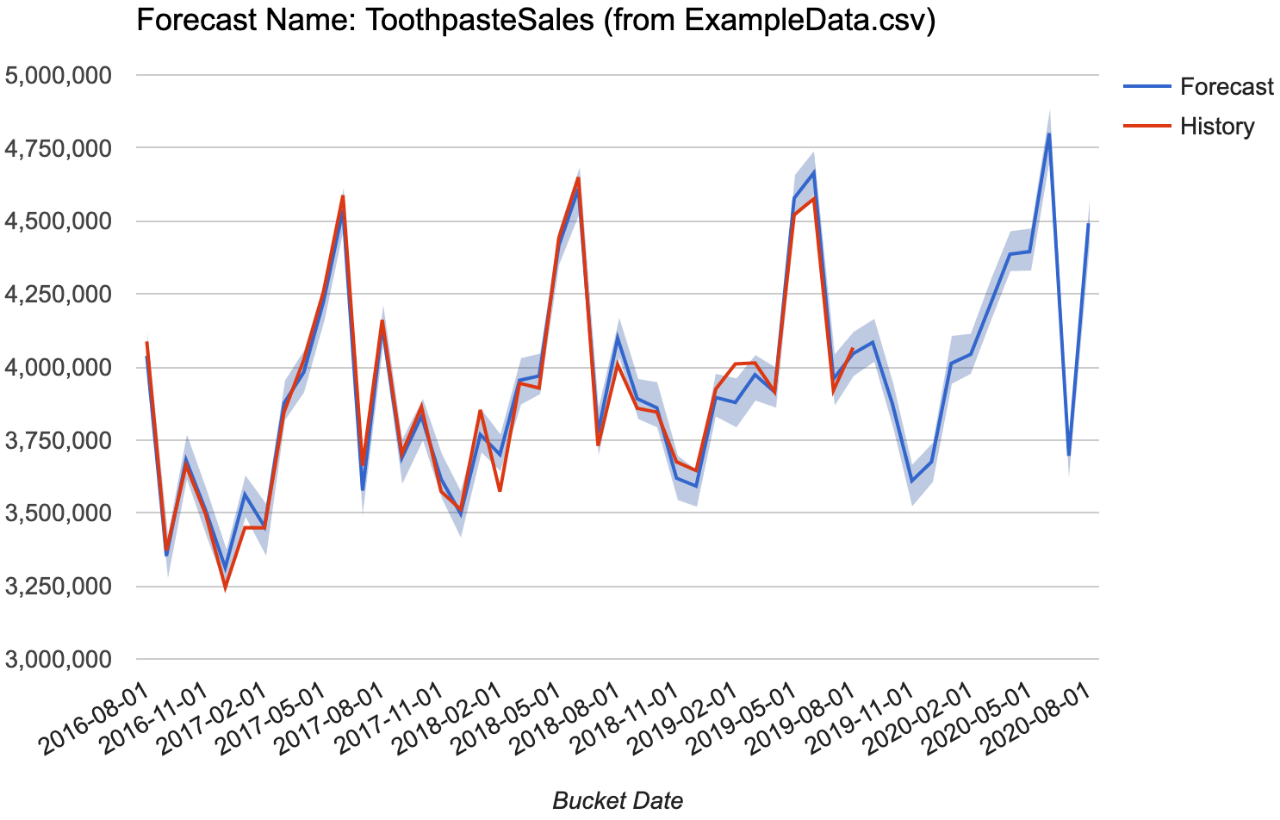
Various actions are listed with each forecast. Clicking on the 'Chart' button will generate a line chart visualization of your forecast.
Various metrics are reported to help you assess the reliability of the forecast. The metrics reported include:
- Coverage
This is the percentage of forecasted data points that fall within an 80% confidence interval. In other words, for each data point we calculate a condidence interval (e.g. +/- 10 units), then we determine whether or not the forecast is within actual +/- the confidence interval. - Root Mean Squared Error(RMSE)
The error in each period is raised to the power of 2 and then averaged for all periods. Expect this number to be quite high since periods with big errors severely penalize this metric. - Mean Absolute Error(MAE)
We take the absolute value of the error for each period and then avarage it for all periods. Over and under forecasting is given the same weighting and this value is always positive. - Mean Absolute Percentage Error(MAPE)
Here we calculate the percentage absolute error for each period and then average for all periods. Because this calculation requires a non-zero denominator for each period, it cannot be cacluated for time series that contain negative periods. We have modified the calculation to allow periods where both history and forecast is zero since this equates to a 0% error. - Bias
This tells you the percentage by which your total forecast is over or under the equivalent historic period. In other words taking the sum of total forecasts and dividing by the sum of the validation period historic values. This is probably the most practically useful metric, indicating the directional accuracy of your forecast. The closer the value is to 100%, the better. A value greater than 100% indicates that we tend to over forecast. A value under 100% indicates a tendency to under forecast. - Horizon used for Metrics
This value is informational only. It tells you how many periods were used for cross validation. This will typically be 1 year, but could be less if the amount of data provided is less than 1 year.
